I think that the first time I encountered the term “pew gap” was in the middle-to-late 1980s, as the side effects of the post-Roe v. Wade era began to emerge.
That was when people started talking about the impact of the Religious Right on the Republican Party and the growing secularization of the elites at the top of Democratic Party structures, where old-school labor union Catholics were being replaced by various kinds of white-collar groups linked to academia and feminism.
At the end of the 20th Century, the “pew” or “God gap” was a given. I know that I have used it before, for this piece of the “Blue Movie” essay that The Atlantic ran in 2003 remains perfect:
“Early in the 1996 election campaign Dick Morris and Mark Penn, two of Bill Clinton’s advisers, discovered a polling technique that proved to be one of the best ways of determining whether a voter was more likely to choose Clinton or Bob Dole for President. Respondents were asked five questions, four of which tested attitudes toward sex: Do you believe homosexuality is morally wrong? Do you ever personally look at pornography? Would you look down on someone who had an affair while married? Do you believe sex before marriage is morally wrong? The fifth question was whether religion was very important in the voter’s life.
Respondents who took the “liberal” stand on three of the five questions supported Clinton over Dole by a two-to-one ratio; those who took a liberal stand on four or five questions were, not surprisingly, even more likely to support Clinton. The same was true in reverse for those who took a “conservative” stand on three or more of the questions. (Someone taking the liberal position, as pollsters define it, dismisses the idea that homosexuality is morally wrong, admits to looking at pornography, doesn’t look down on a married person having an affair, regards sex before marriage as morally acceptable, and views religion as not a very important part of daily life.) According to Morris and Penn, these questions were better vote predictors — and better indicators of partisan inclination — than anything else except party affiliation or the race of the voter (black voters are overwhelmingly Democratic).”
This brings us to another set of charts created by Ryan Burge, a political scientist who is also an ordained Baptist progressive. As I keep saying, journalists who cover religion need to follow this guy on Twitter and bookmark this website — Religion in Public.
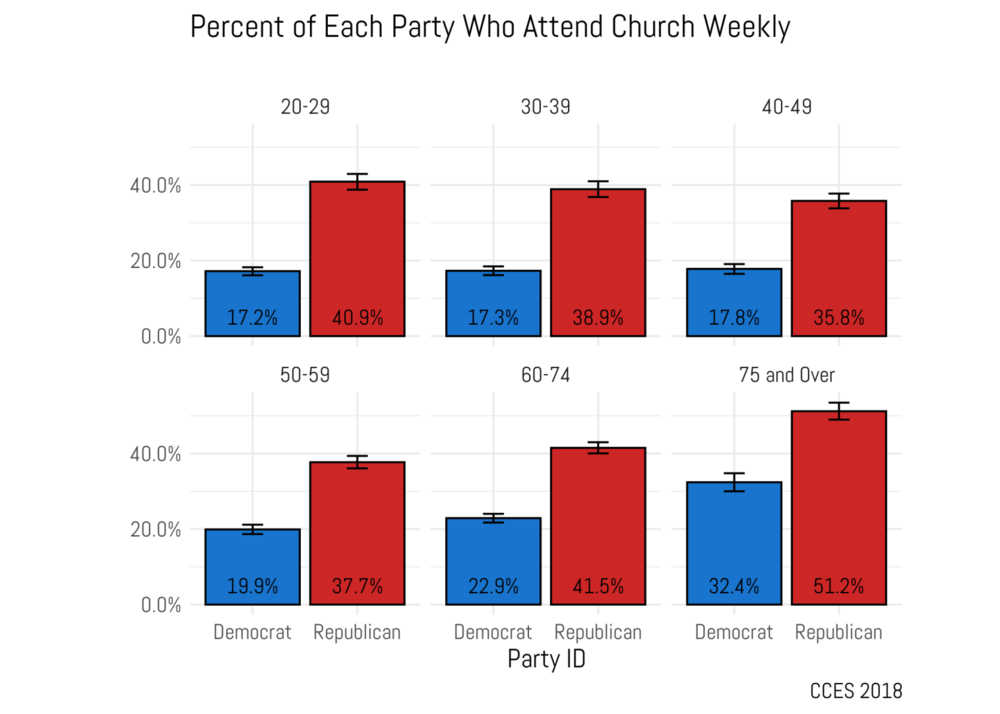
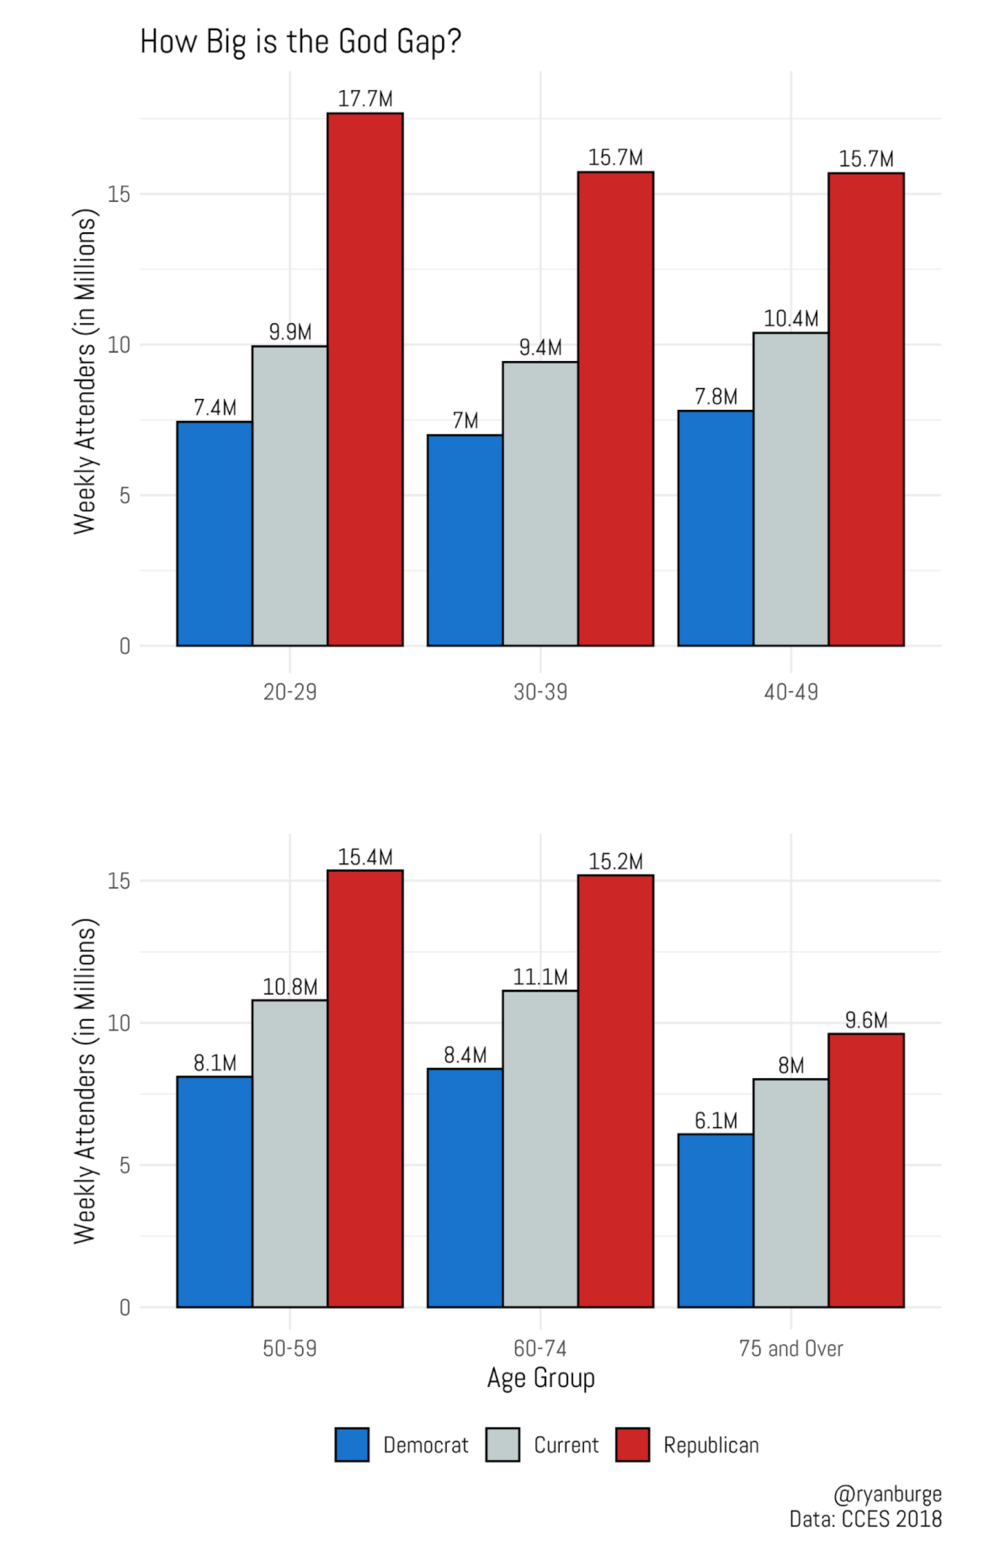
These two charts (used with his permission, of course) are from an article entitled: “How Big is the God Gap?”
Another way to phrase that: “What would happen to American religion if these bar graphs were entirely blue or entirely red?”
Background from Burge:
“To get a sense of just how large the God Gap is, I calculated the percentage of Republicans and Democrats who attended church at least once a week or more for each of the six age groups previously described. To me, this is the simplest and most straightforward way to understand the differences in religious behavior of political partisans. Some of the gaps are huge.
For respondents in their twenties, the total God Gap is nearly 24 percentage points. Over four in 10 Republican twenty-somethings attend church once a week or more, compared to less than one in five Democrats. The numbers don’t actually shift that much as you move across the top row. For Democrats, the share stays between 16% and 18%, however the Republican bars do get shorter, dropping from 40.9% to 35.8% for those in their forties. The bottom row shows a consistent increase for both Republicans and Democrats at nearly the same rate. The gap for those who are 50 years old and older is about18 percentage points. However, it’s crucial to note that the absolute share of both Democrats and Republicans moves up in each successive graph — older people do go to church more often. Note that half of all Republicans and a third of all Democrats who are at least 75 years old attend church once a week — easily the highest rate of any age group.
”
So what about this question: “How many more people would be in the pews every Sunday if we attended like Republicans and how empty would they be if we are all Democrats?”
Burge explains the methods — by all means read all of his post — but ends up here:
“Here’s the broad result — if we were all Republicans, churches, synagogues, and mosques would be standing room only affairs. For instance, if 40% of all 20-29 year olds were in church there would be 17.7 million of them — compared to just 9.9 million who currently attend today. That’s a function of two things — how religiously active young Republicans are, but also how just 26.1% of twenty-somethings affiliate with the GOP. This exercise would double their numbers and expand church membership. On the other hand, if all those in their twenties were as active as Democrats that would leave just 7.4 million church goers, a decline of 2.5 million people from the current environment. The total swing in attendance in these two scenarios is over 10 million twenty-somethings.”

So I will end with another question: So what do these numbers mean if you are the leader of a progressive Christian flock whose doctrinal stands align perfectly with the Democratic Party, but less than perfectly with centuries of traditional doctrines on moral and social issues?
How many people are in your pews right now and what patterns are you seeing in terms of their ages?


